Industrial Real-Time 3D Case Study

WindTwin Operational Wind Farm Digital Twin

Monitoring, condition intelligence, maintenance coordination, and a scalable 100-turbine WebGL environment in one browser experience.

WindTwin


  • DIGITAL TWIN
  • WEBGL
  • INDUSTRIAL

From Fault Detection to Asset Recovery

WindTwin is not presented as a decorative 3D scene. It models an operational loop: monitor the asset, detect a fault, generate a work order, dispatch maintenance, complete the repair, and restore the turbine.

The entire workflow runs inside one responsive browser-based experience.

View Live Project

A 3D Wind Farm Designed as an Operational Interface

Real-time 3D · Live context · Simulated operations · Measured performance

100 Turbines · End-to-End Maintenance Workflow · Near-60 FPS in Most Tested Environments

WindTwin is a browser-based operational Digital Twin prototype that explores how industrial assets can be monitored, investigated, and serviced through a shared real-time 3D interface.

The project connects a Three.js wind-farm environment with live weather context, simulated turbine telemetry, fault scenarios, operational charts, prioritized work orders, personnel data, supplies, and an animated maintenance vehicle.

It was built as an independent end-to-end project covering product concept, system architecture, front-end engineering, 3D integration, interaction design, simulation logic, responsive UI, and performance optimization.

Key Results

100-Turbine Environment

Four full-detail assets supported by 24 medium- and 72 low-detail turbines loaded on demand.

Measured Performance + Adaptive Quality

Runtime diagnostics track FPS, draw calls, triangles, pixel ratio, GPU information, and loading metrics while the quality system adapts rendering cost to sustained device performance.

Closed Operational Loop

Fault detection, alert creation, work-order prioritization, dispatch, repair, reporting, and recovery are connected.

Transparent Data Model

Live weather context is clearly separated from simulated telemetry, faults, workforce, and maintenance operations.

Full-Farm Desktop Diagnostic Snapshot

Measured directly inside the running application on an NVIDIA GeForce GTX 1060 3GB desktop system.

WindTwin measured performance with the expanded wind farm loaded

Avg FPS60.3

Min FPS59.8

Draw Calls39

Triangles214,257

Pixel Ratio / Quality1.25 / High

A local diagnostic recorded the core experience as fully loaded in 0.38 seconds. In browser and network testing, initial loading has typically been around 1–2 seconds, depending on connection, device, and cache state.

These figures represent different test conditions: the 0.38-second value is a local core-load diagnostic, while the 1–2 second range reflects practical browser delivery rather than a universal guarantee.

Project Overview

WindTwin investigates a specific question: can real-time 3D become a useful operational layer rather than remaining a visual presentation?

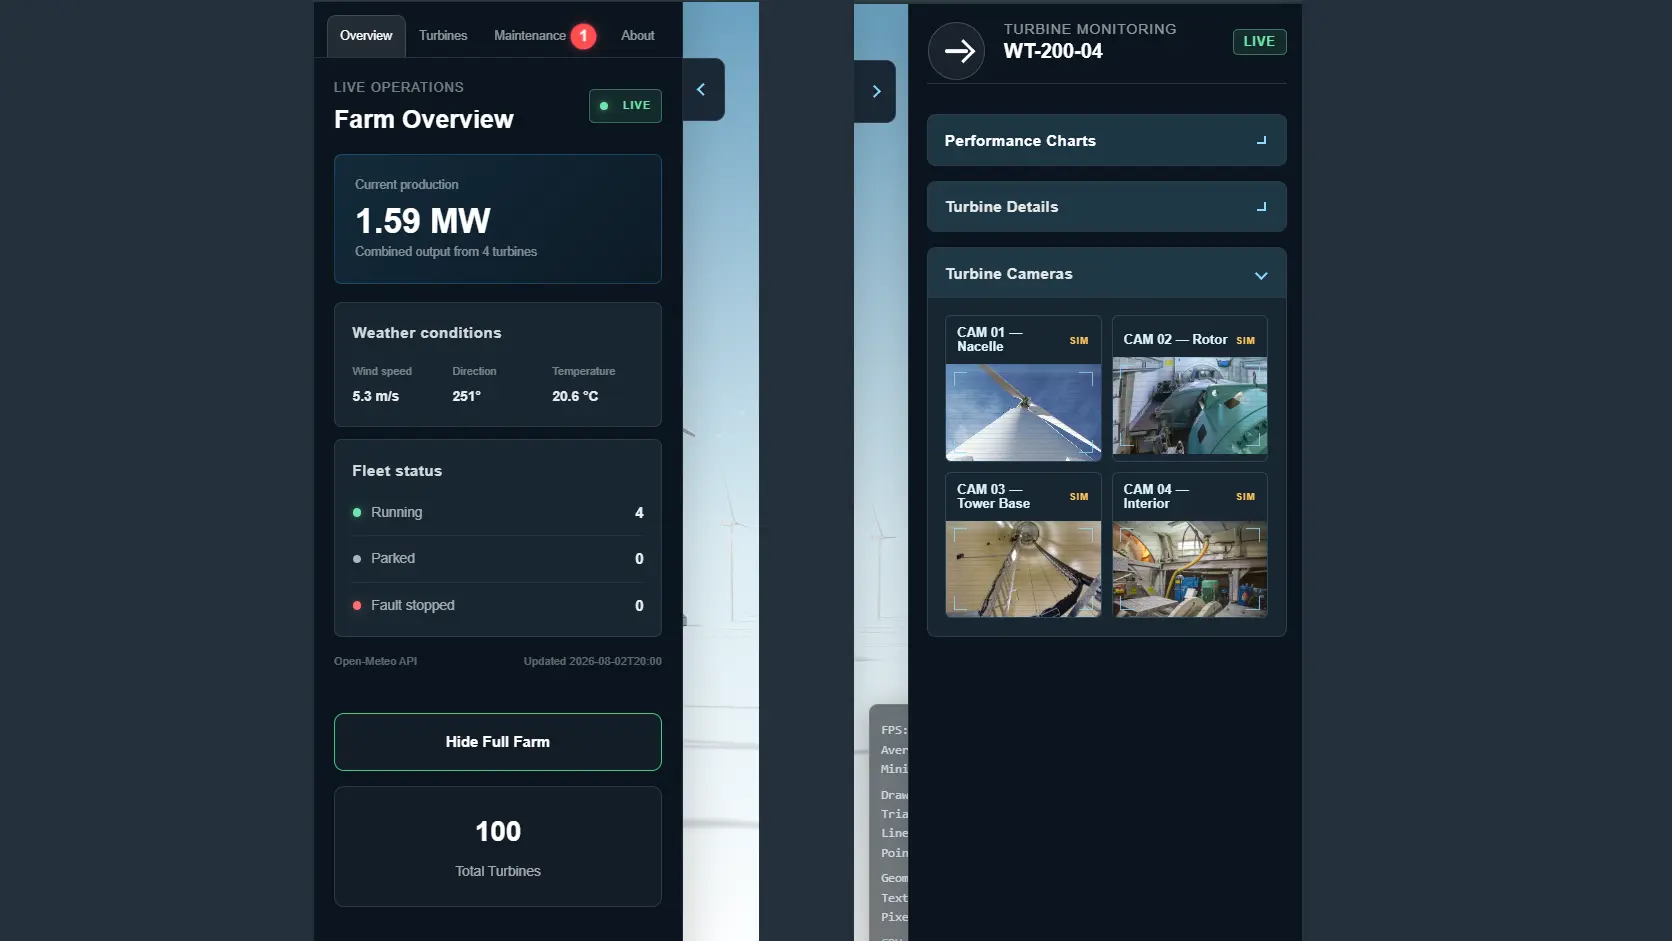
The answer was approached by designing the scene, data model, UI, and maintenance logic as one connected system. Selecting a turbine exposes its state, charts, fault information, maintenance dates, recommended actions, and simulated camera views. Selecting the service vehicle or Operations Center reveals the human and logistical side of the same event.

The result is a product-style prototype that demonstrates how asset context, spatial location, system state, and operational action can meet inside a single browser interface.

Role and ownership:
Independent project — product concept, information architecture, technical architecture, 3D implementation, TypeScript development, simulation logic, UI/UX, responsive behavior, performance work, analytics, and deployment.

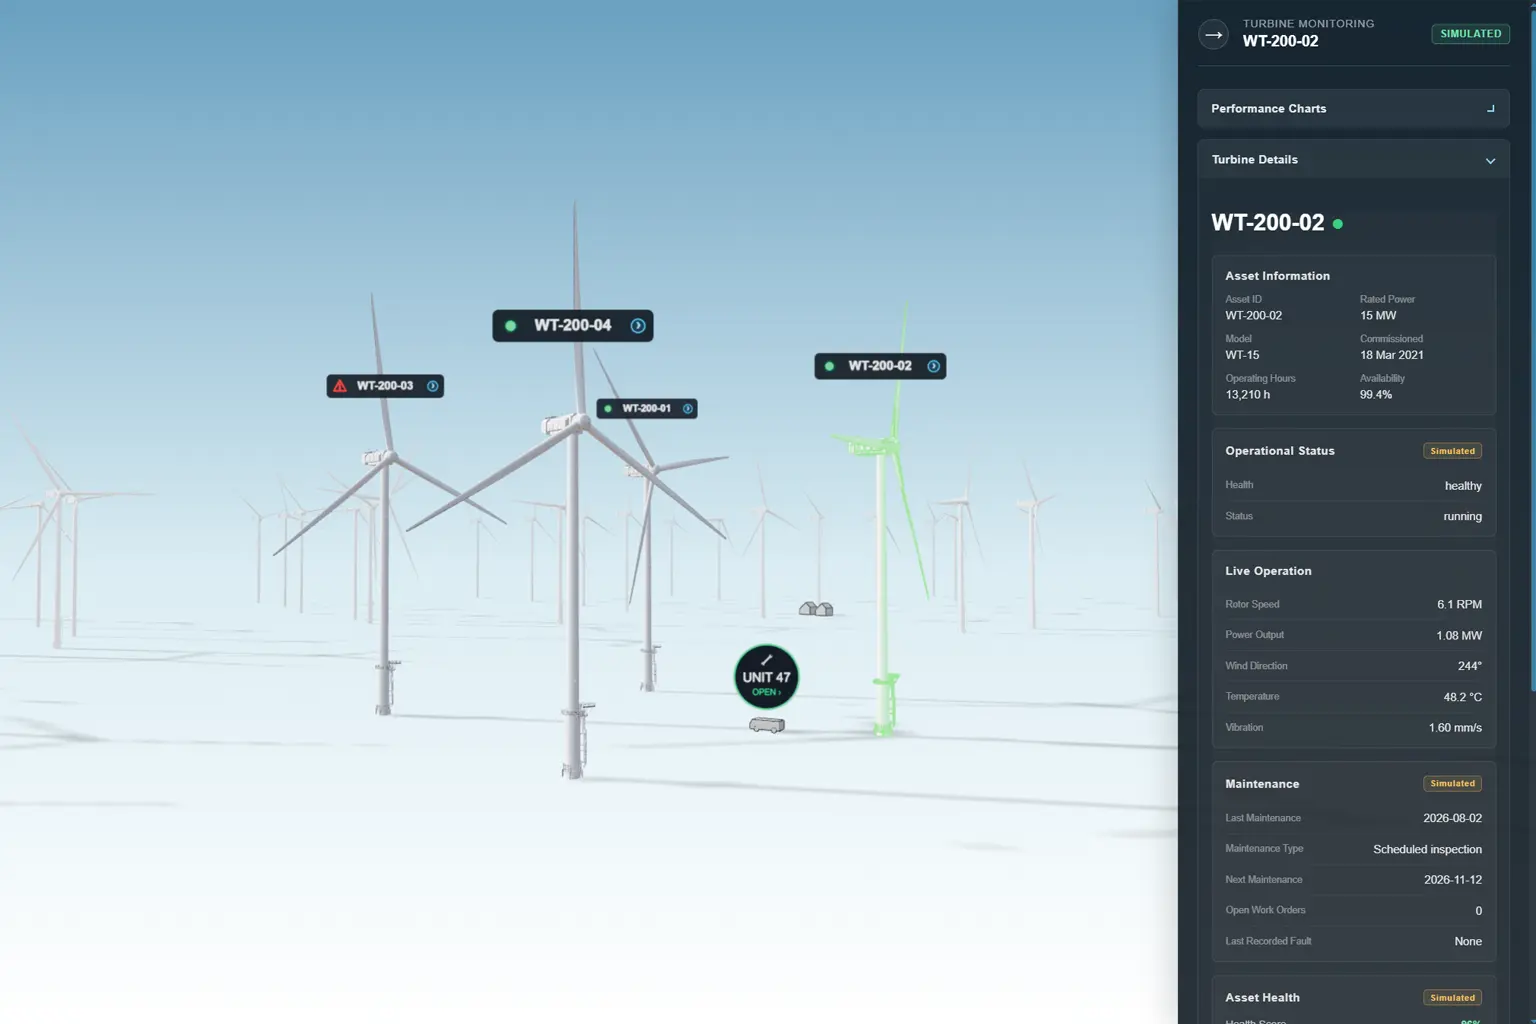
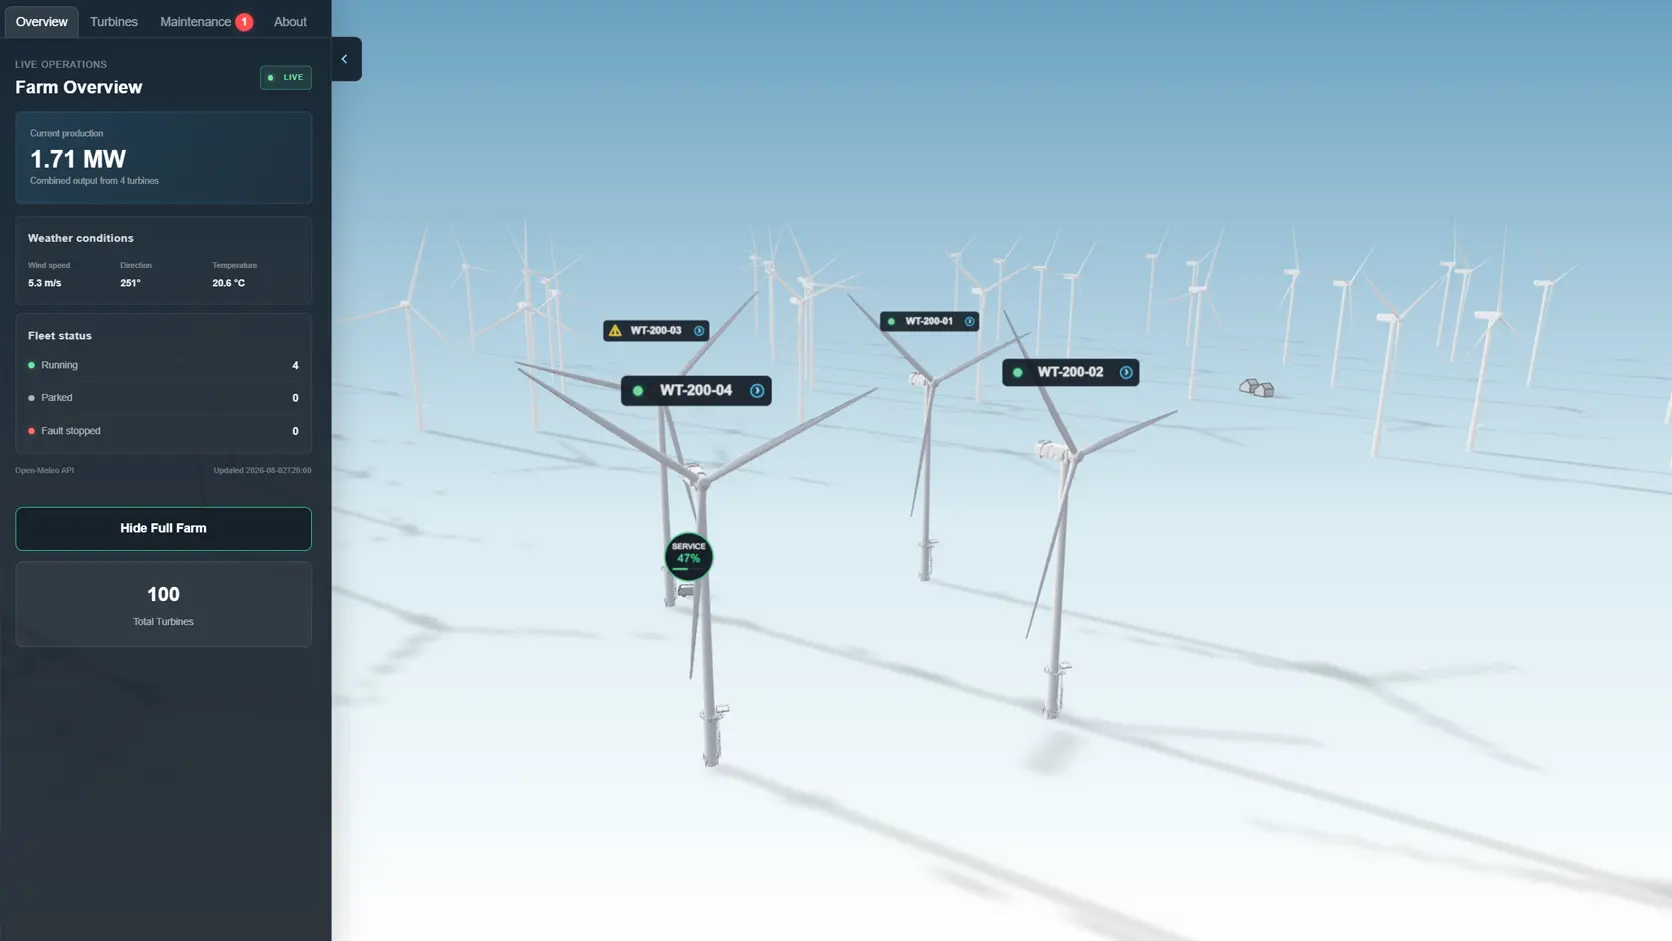
WindTwin project overview with turbines, monitoring panels, and maintenance vehicle

The Challenge

Industrial information is often fragmented across dashboards, tables, alarms, maintenance systems, workforce tools, and physical location knowledge.

A conventional 3D scene may communicate shape and position, but it does not automatically explain asset health, operational priority, responsibility, or what should happen next.

WindTwin therefore had to solve several problems at the same time: represent a large environment, preserve responsive rendering, keep operational state consistent, make faults understandable, connect alerts to maintenance action, and remain usable on both desktop and mobile screens.

The central challenge was not producing more visual detail. It was deciding which information belongs in the 3D world, which belongs in the interface, and how both should react to the same source of state.

Operational monitoring challenge represented through WindTwin

The Product Strategy

WindTwin was deliberately built around an operational narrative rather than a gallery of disconnected features.

The primary user journey begins with the farm overview, moves into a selected asset, exposes changing telemetry and health, creates a fault and work order, dispatches a field team, tracks service progress, records the result, and restores the turbine.

This structure makes every subsystem support the same purpose. The charts explain condition. The scene explains location. The work-order queue explains priority. The vehicle explains execution. The personnel and supplies views explain operational readiness.

That system-level coherence is the main value of the project. It demonstrates product thinking beyond rendering alone.

System Architecture

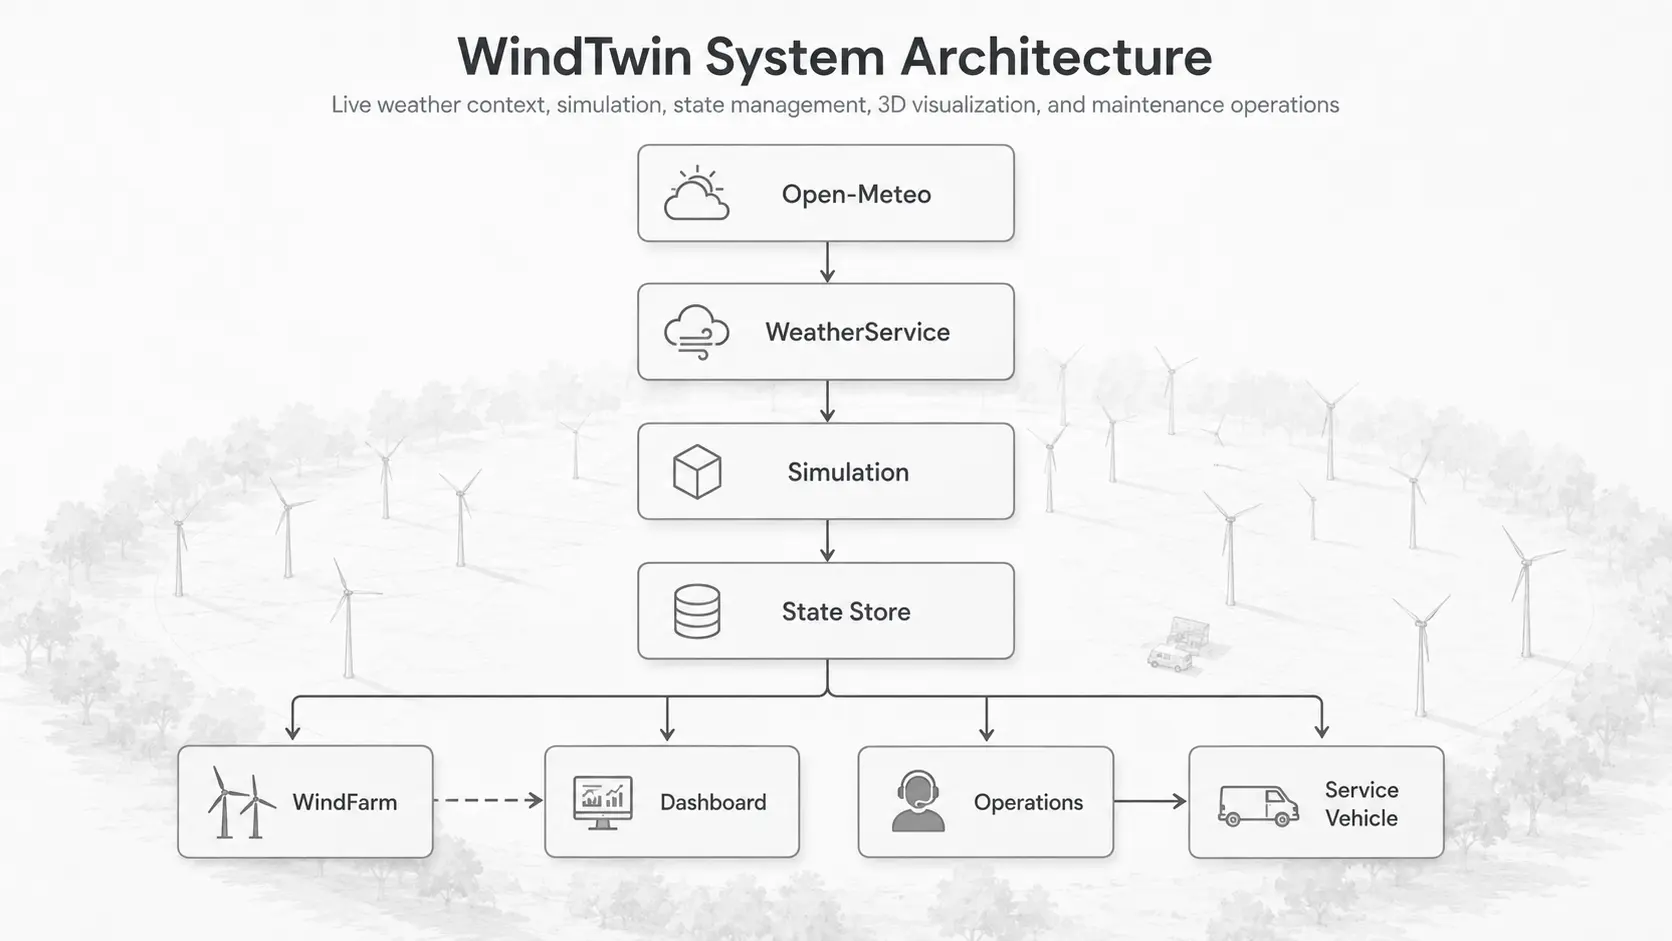
The application separates external context, simulation, centralized state, 3D synchronization, operational logic, and UI rendering.

Open-Meteo provides current weather context. A demonstration wind normalizer keeps the portfolio experience active. The turbine simulation derives operating values. A central state store becomes the shared source for the wind farm, dashboards, charts, alerts, work orders, Operations Center, and service vehicle.

This separation prevents the scene and the interface from becoming independent versions of reality. Both respond to the same state and the same operational events.

Non-critical systems are intentionally deferred. The expanded farm, Operations Center, employee views, runtime diagnostics, analytics, and Chart.js are loaded dynamically when they are actually needed, reducing the cost of the initial application path.

WindTwin architecture connecting weather, simulation, state, 3D assets, dashboards, and maintenance operations

Core modules:
Engine and lifecycle · Weather service · Turbine simulation · State store · Wind farm synchronization · Scene interaction · Dashboard controller · Operations controller · Service vehicle · Employee and Operations Center views · Live charts · Audio manager · Quality manager · Performance monitoring · Session analytics

Live Context and Simulated Operations

A credible Digital Twin case study must be explicit about its data. WindTwin does not pretend that browser-generated values come from physical turbines.

Live data:
Wind speed at 100 metres, wind direction at 100 metres, air temperature, and observation time are requested from Open-Meteo.

Simulated data:
Rotor speed, power, generator temperature, vibration, health, faults, work orders, personnel, supplies, vehicle movement, maintenance reports, and camera feeds are generated by the internal demonstration system.

To prevent an inactive portfolio demo during calm or extreme live weather, the displayed weather remains live while the turbine model uses a normalized 5–12 m/s operating input. This decision is visible and documented rather than hidden.

WindTwin live and simulated data separation diagram

Condition Monitoring and Asset State

Each primary turbine maintains a structured operating state rather than a collection of unrelated UI values.

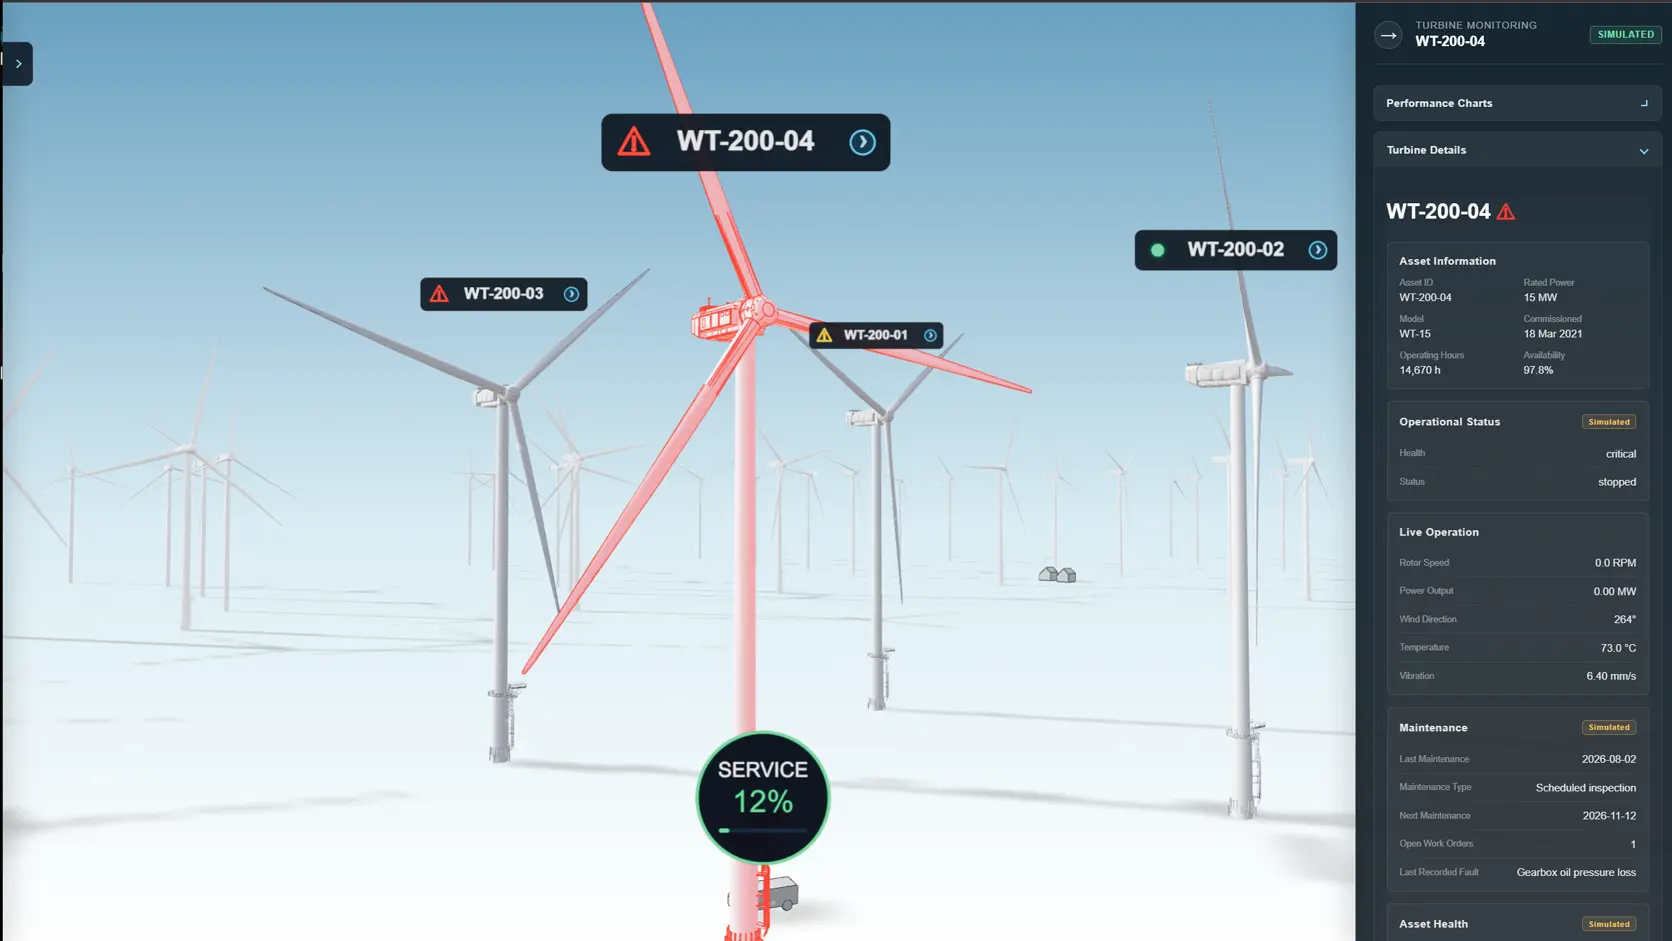
The model includes rotor speed, generated power, wind direction, temperature, vibration, operating hours, maintenance dates, health, status, error code, stop reason, stop time, and recommended action.

Live charts retain recent samples for power, rotor speed, temperature, and vibration. They update without expensive chart animation and can expand into a focused modal for deeper inspection.

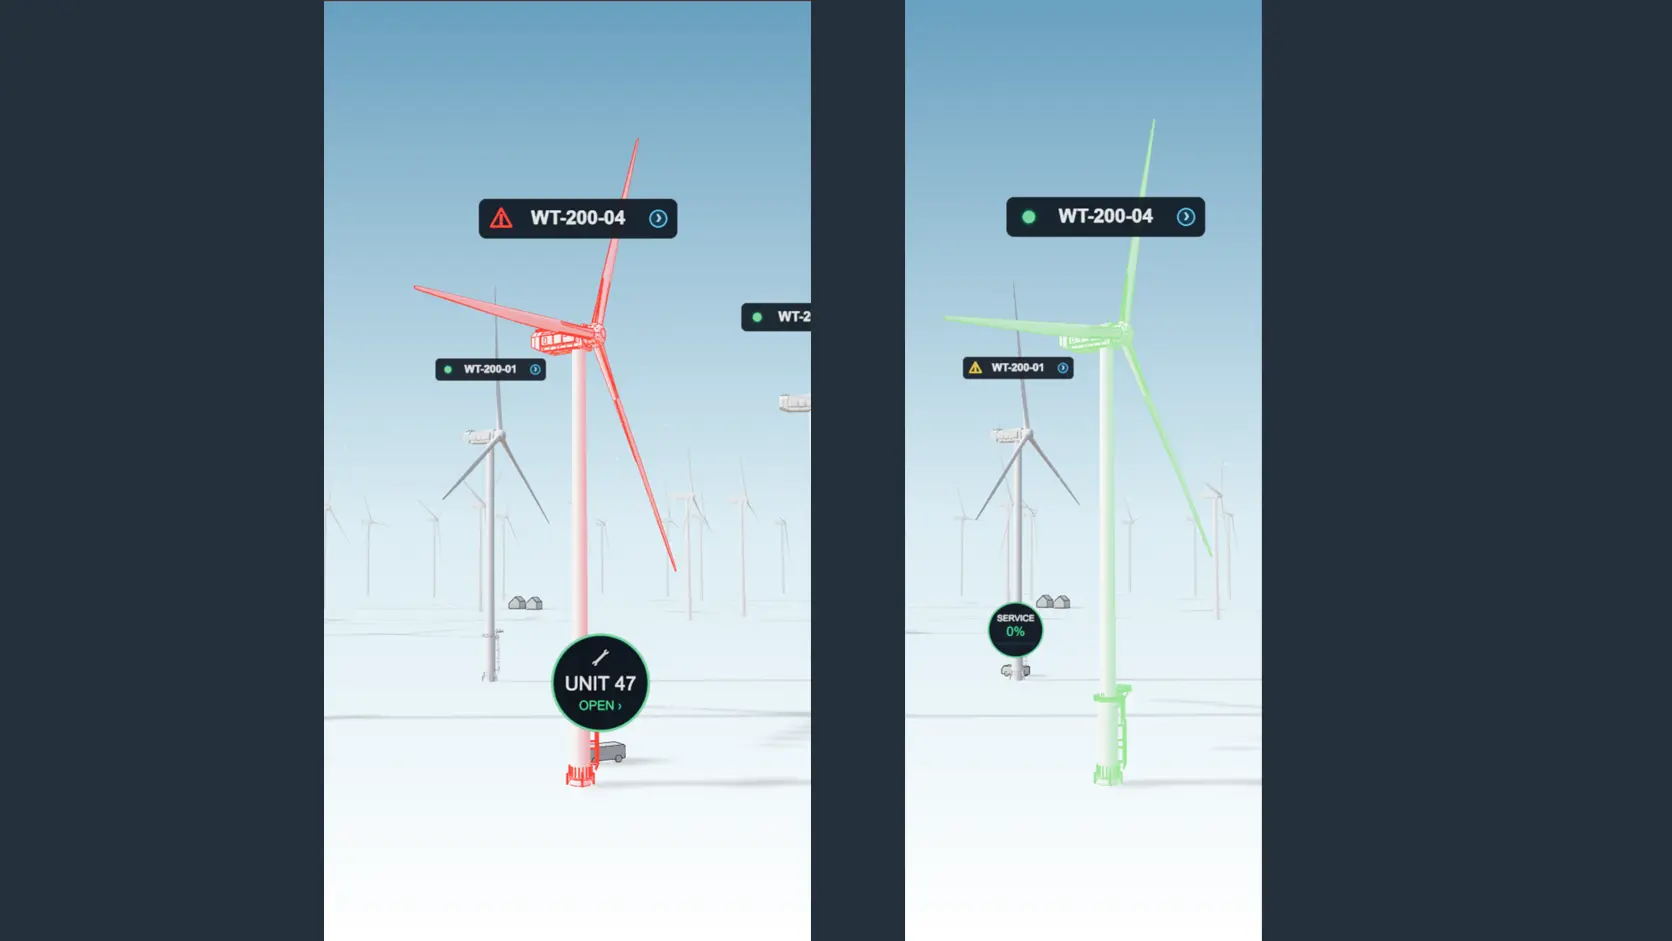
Visual asset states remain consistent across the scene and UI: healthy, parked, warning, and critical conditions use distinct labels, colors, and interaction feedback.

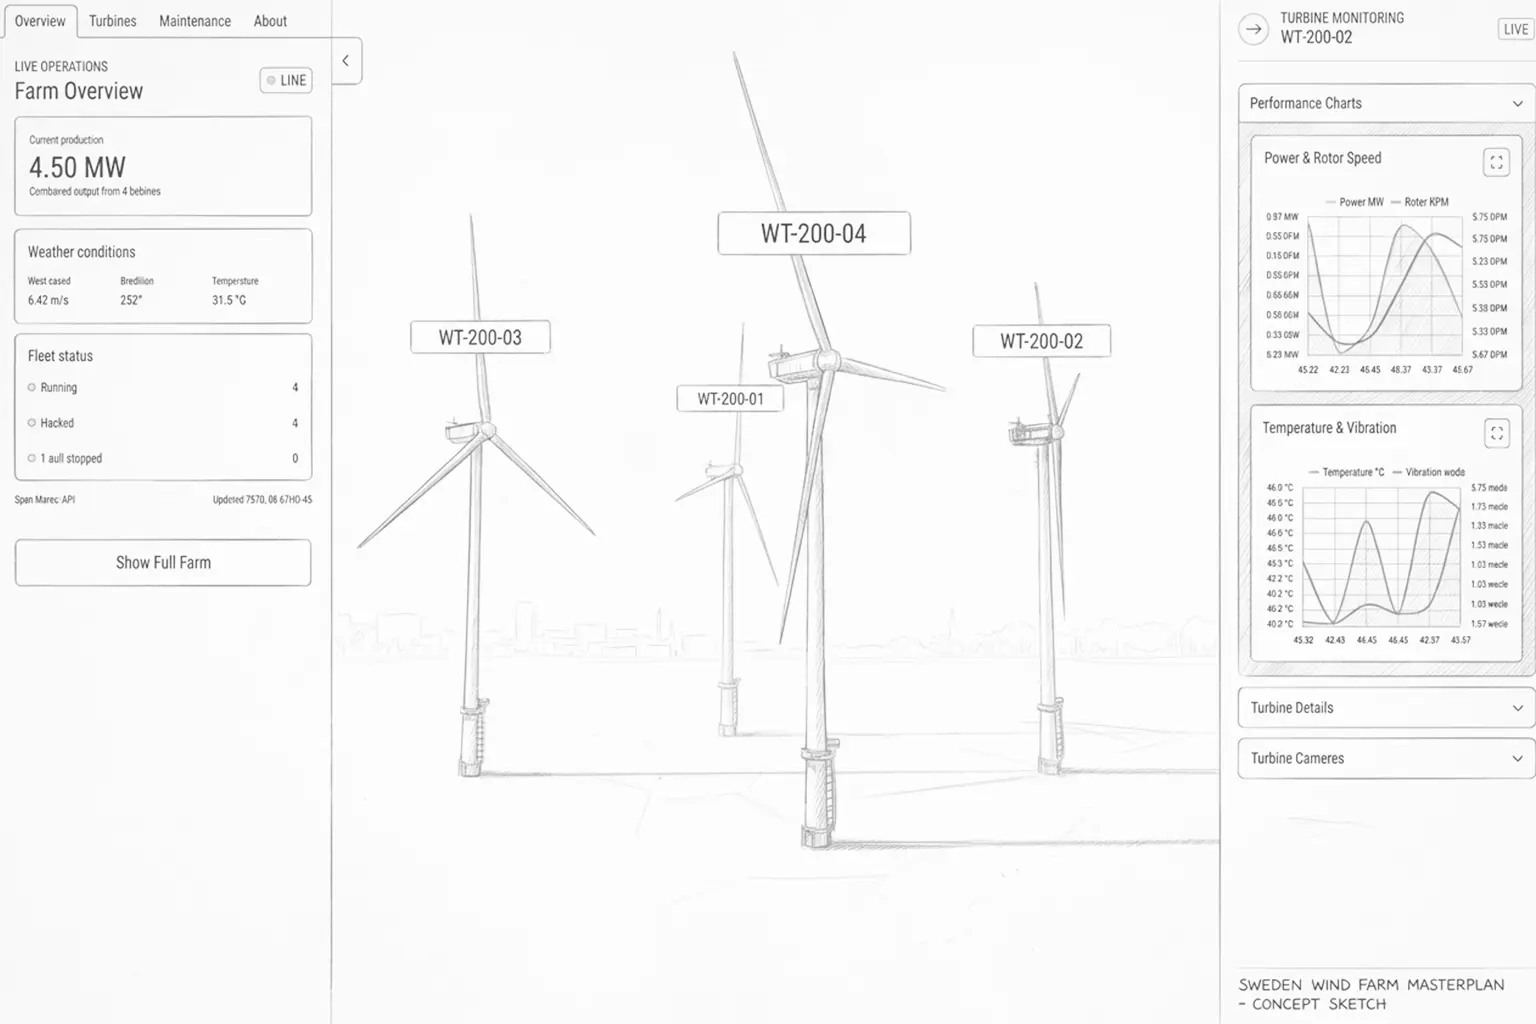
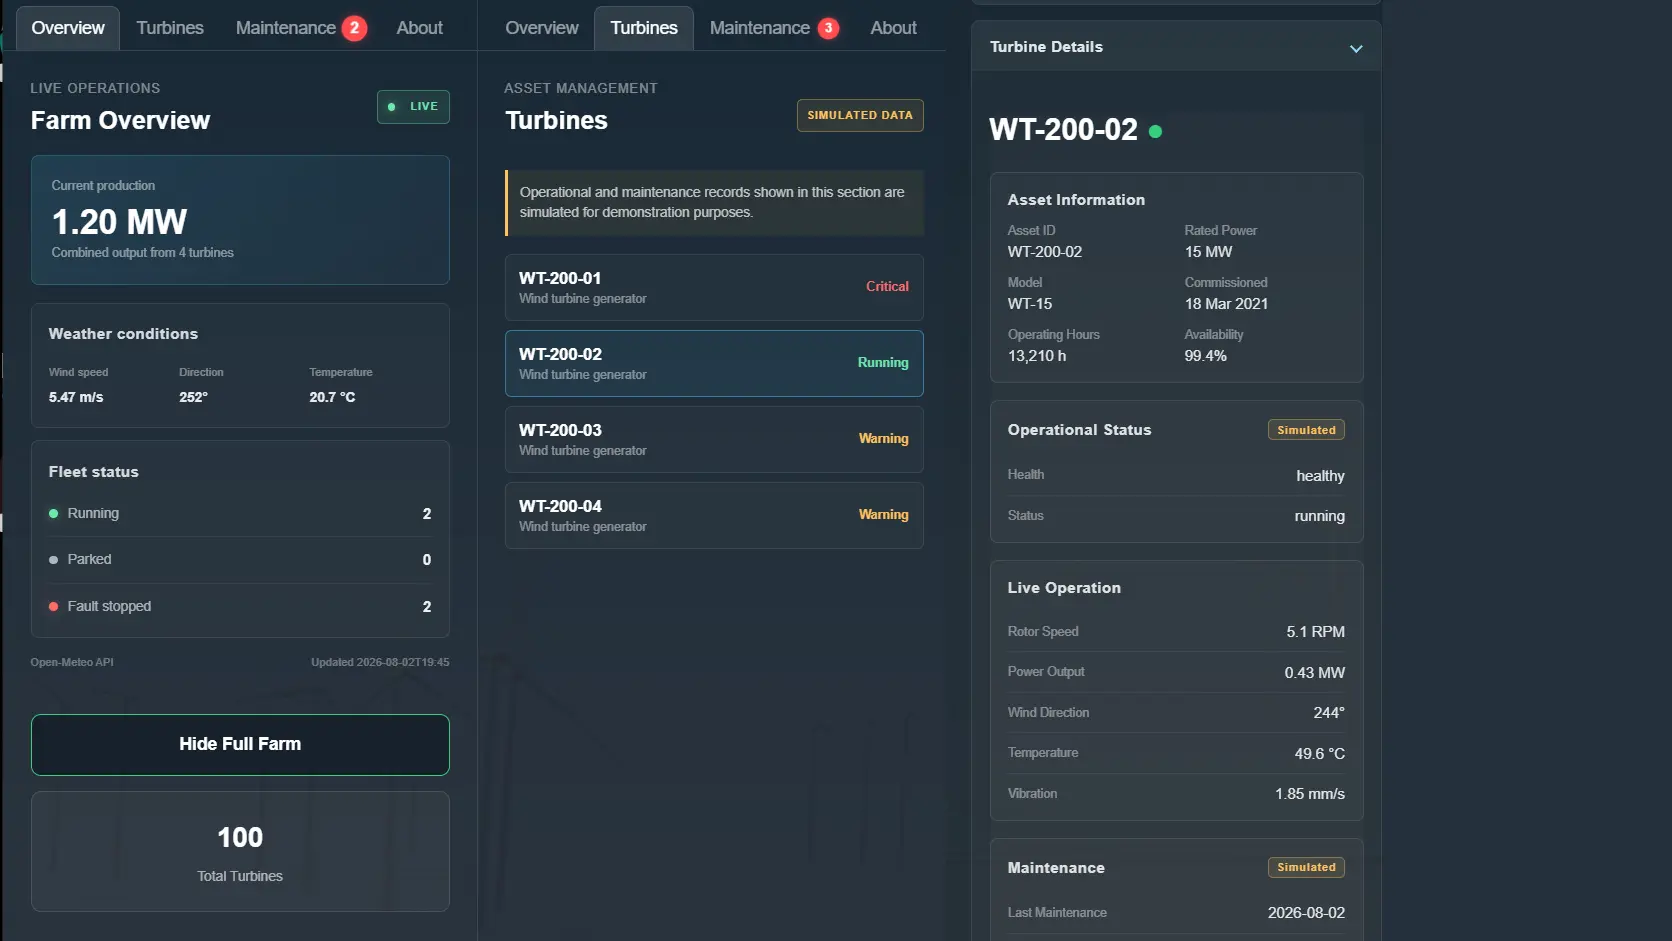
WindTwin turbine condition monitoring with charts and operational data

Fault-to-Repair Workflow

The strongest part of WindTwin is the connection between technical condition and operational action.

The simulation can generate scenarios such as high generator temperature, excessive drivetrain vibration, yaw deviation, gearbox oil-pressure loss, converter cooling degradation, and blade-pitch actuator faults.

A fault can change the turbine state, create an alert, assign a severity and error code, recommend an action, create a linked work order, reserve an operational response, and trigger maintenance dispatch.

Critical faults stop the affected turbine. Warning faults preserve operation while marking the asset as degraded. After service, the work order is resolved, a maintenance report is recorded, the alert is cleared, and the asset returns to operation.

WindTwin fault detection to asset recovery workflow

Prioritized Work Orders and Maintenance History

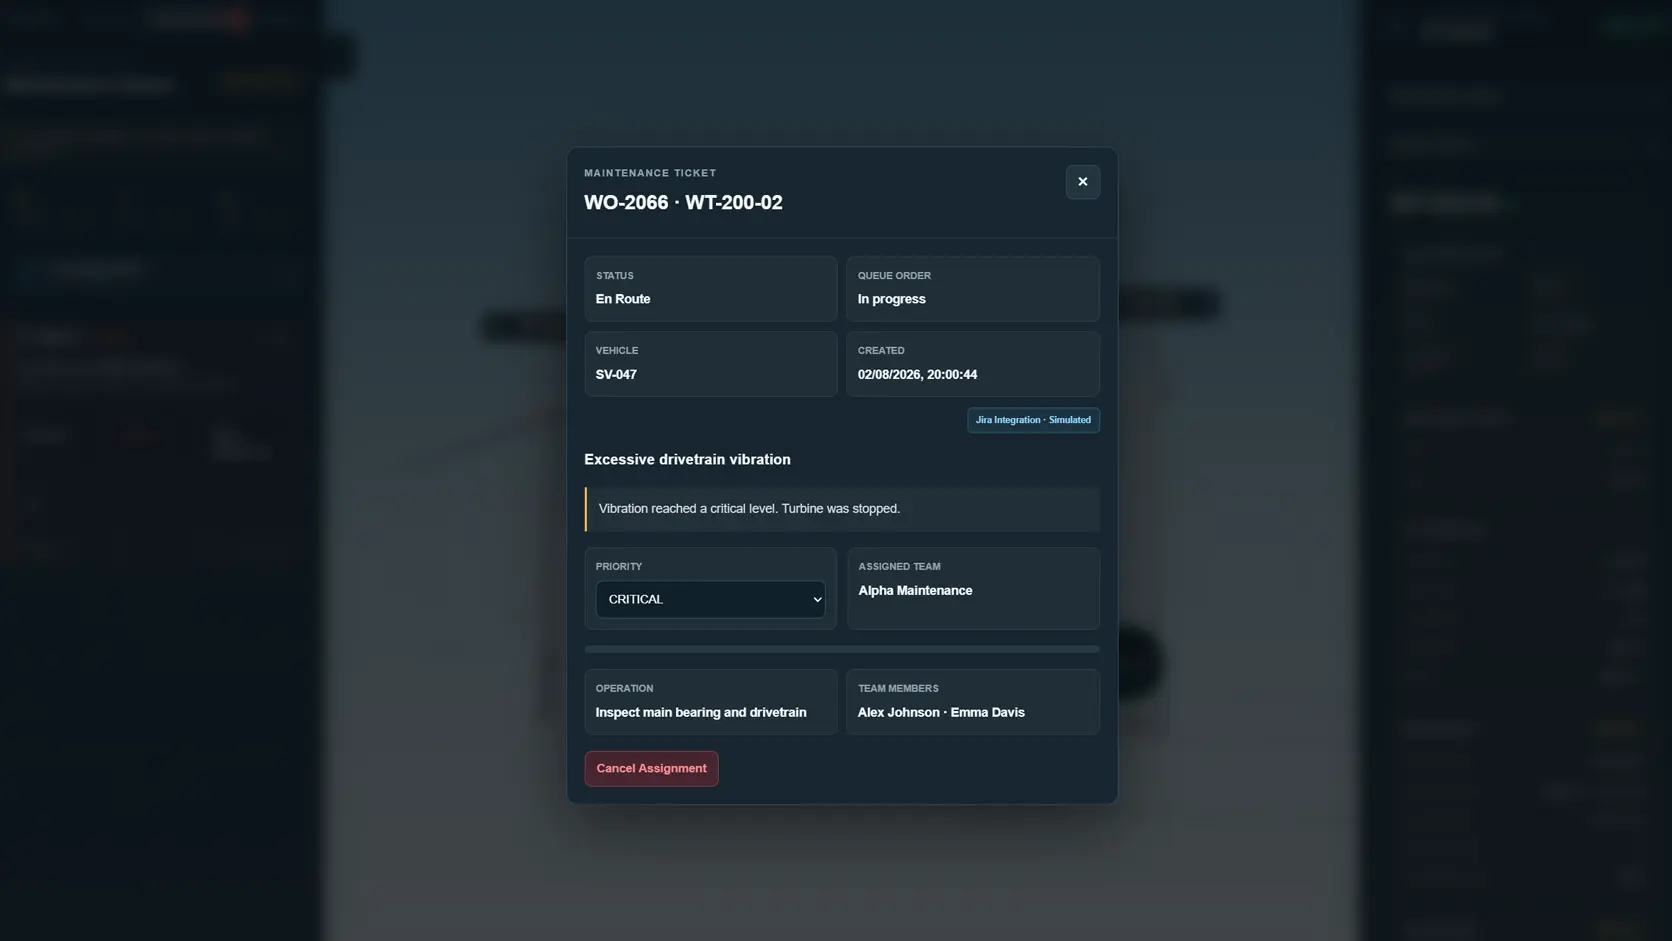
Every operational fault creates a work order containing the affected turbine, priority, status, queue position, assigned team, assigned vehicle, progress, timestamps, location, and final maintenance report.

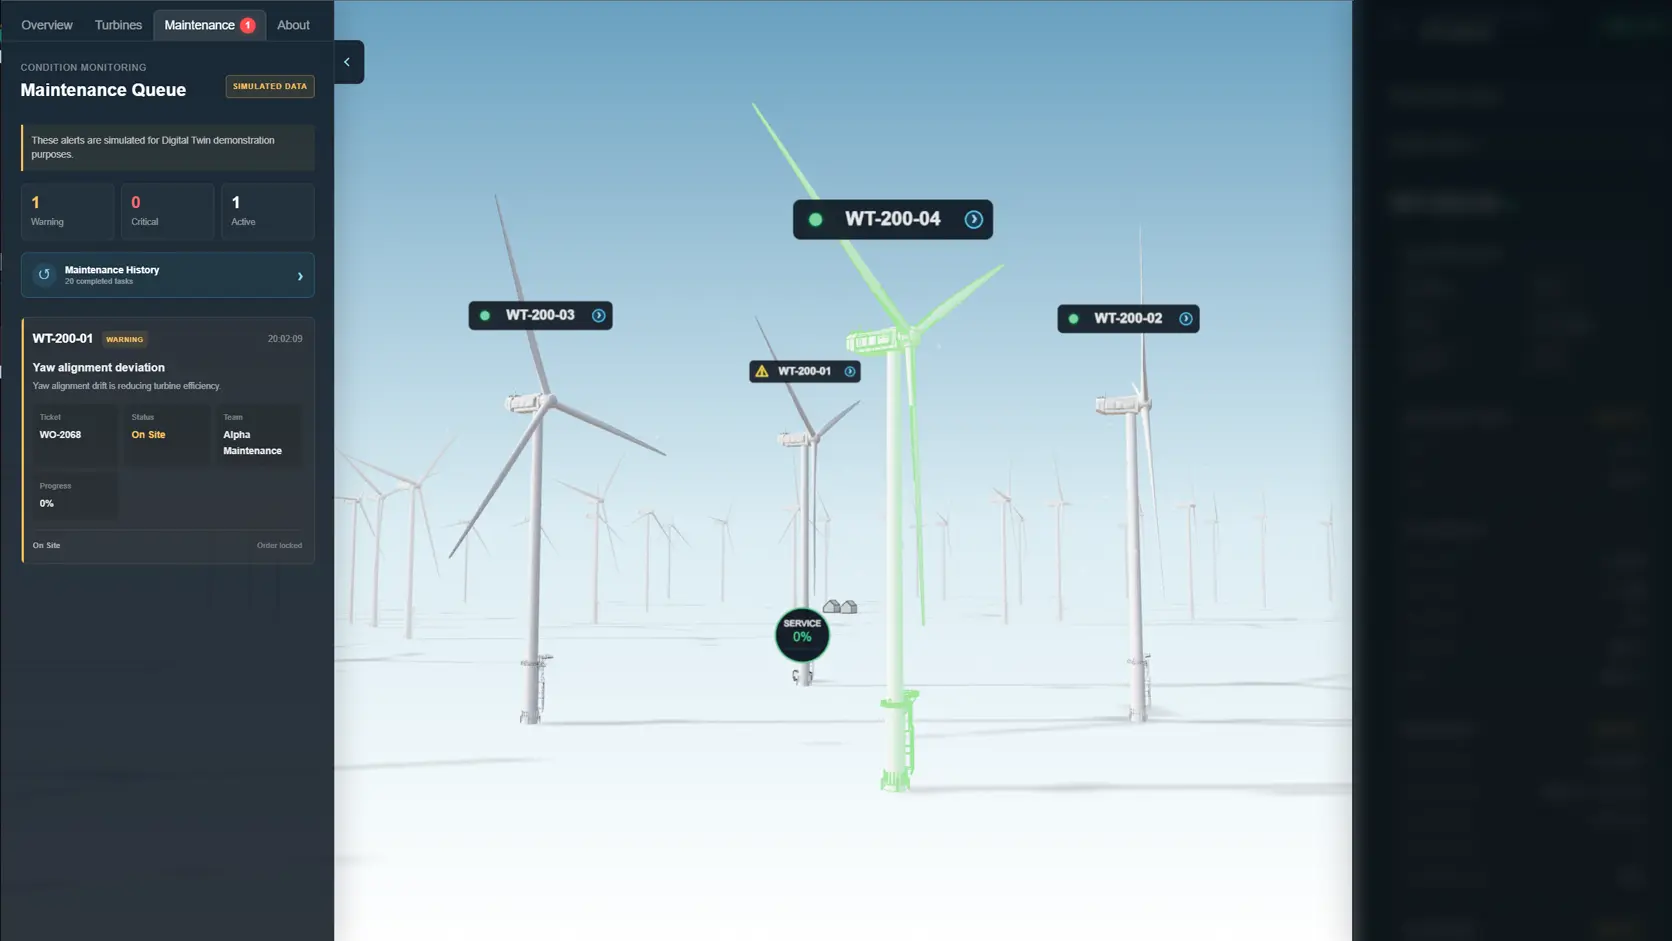
Critical orders are dispatched before high-priority orders. Manual drag-and-drop reordering is allowed inside the same priority group, while active orders become locked once the vehicle is travelling or servicing the asset.

Queue positions are normalized after changes, preventing duplicate or inconsistent ordering. Completed work is preserved in a session history with findings, action taken, result, team, and completion time.

WindTwin prioritized maintenance work orders and completed task history

Maintenance Vehicle as an Operational Actor

The service vehicle is not background decoration. It is controlled by the same work-order state used by the interface.

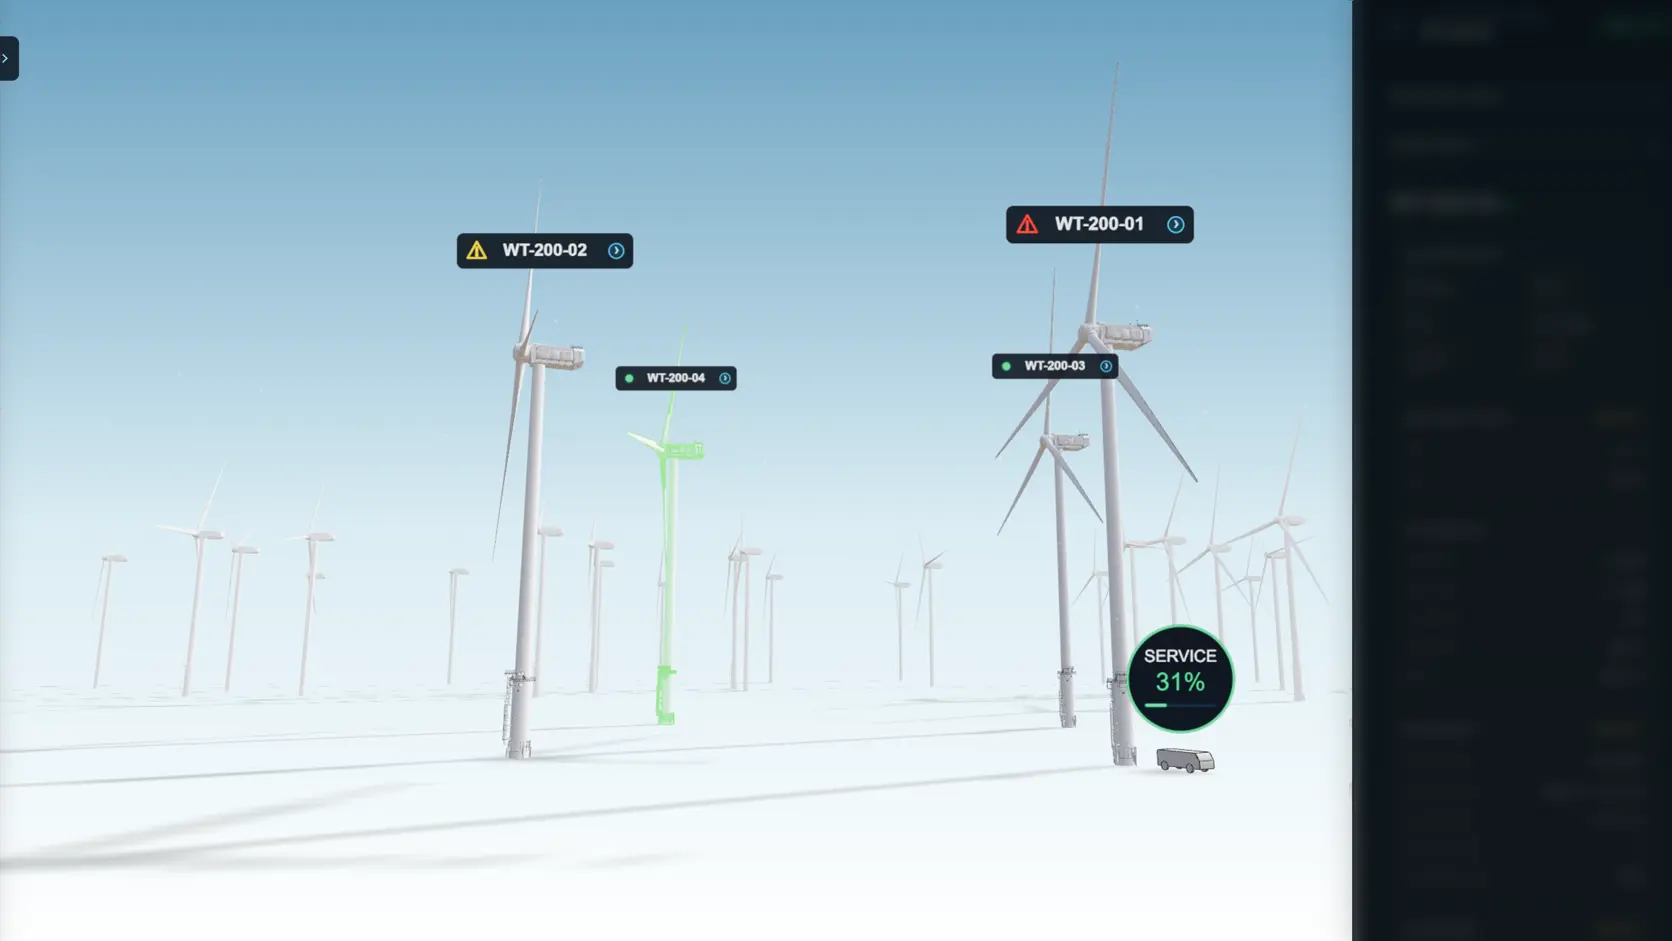
SV-047 leaves the Operations Center, travels to the assigned turbine, changes from en route to on site, begins service, displays live repair progress in the 3D scene, completes the repair, and continues directly to the next queued task when one exists.

It returns to the Operations Center only when the queue is empty. The vehicle panel exposes mission, assigned asset, team, location, destination, speed, ETA, service progress, and remaining service time.

This turns maintenance logistics into visible system behavior rather than a static status field.

WindTwin animated maintenance vehicle SV-047 servicing a wind turbine

Operations Center, Personnel, and Supplies

Selecting the Operations Center reveals the resources behind the repair workflow.

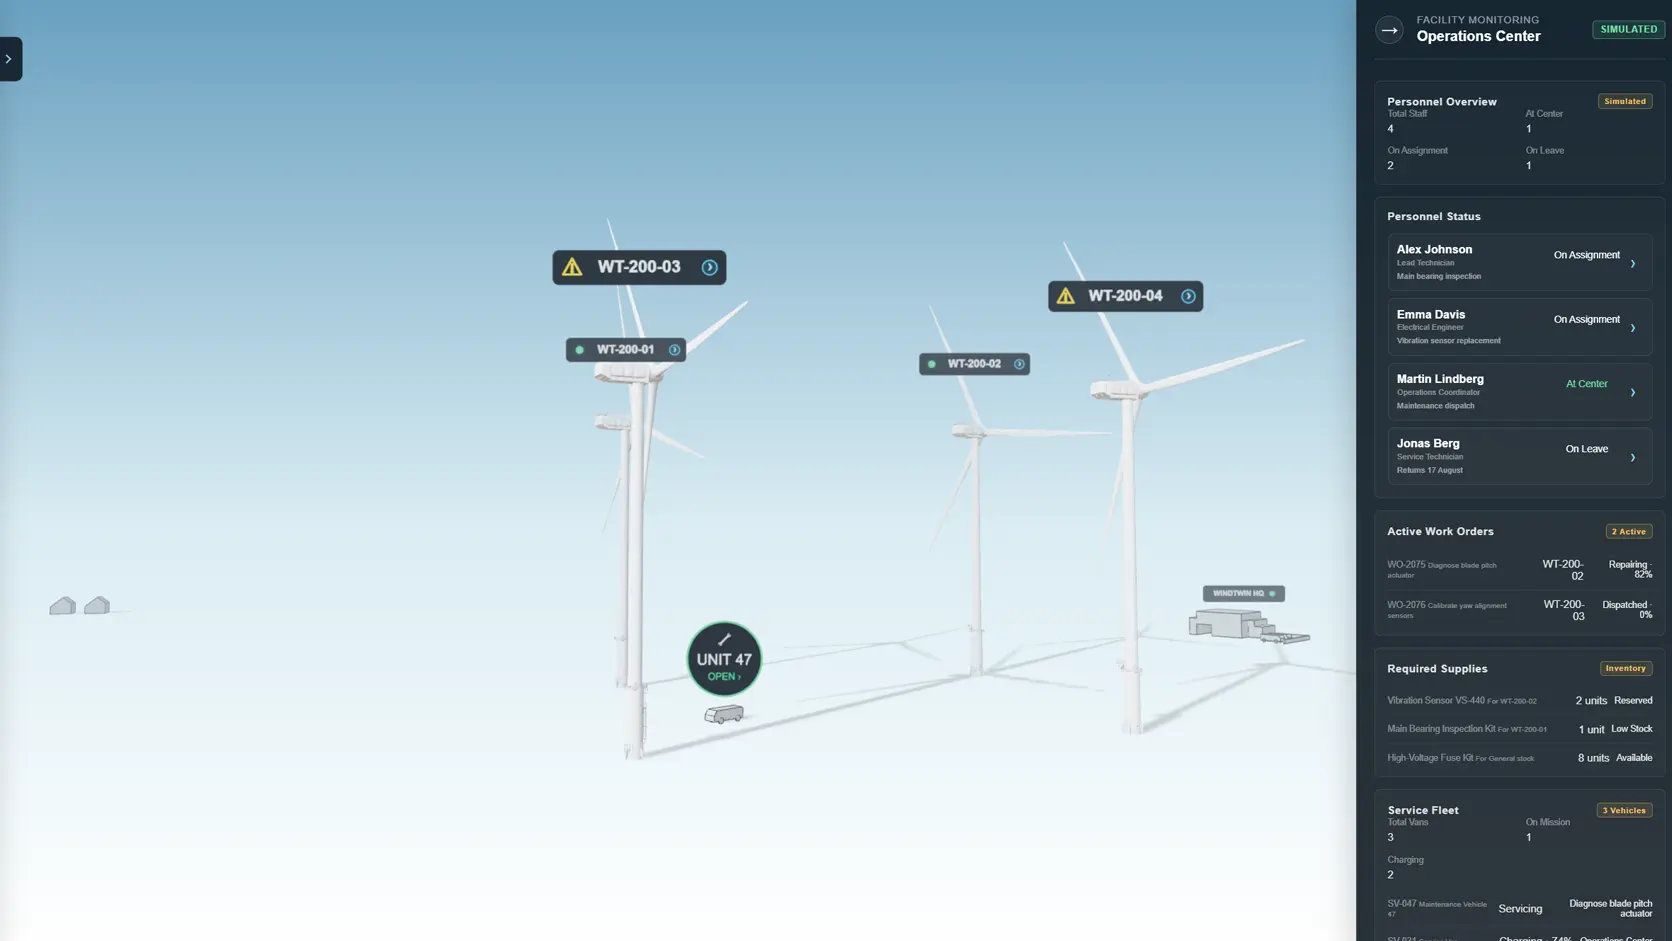
The view combines personnel status, current assignments, leave state, certifications, required supplies, inventory availability, reservations, service fleet, active work orders, and the current vehicle mission.

Employee cards open detailed profiles showing role, specialization, work hours, team membership, current asset, next assignment, and certification context.

These records are simulated, but they demonstrate how spatial asset monitoring could connect with workforce and operational readiness in a larger industrial platform.

WindTwin Operations Center with personnel, supplies, fleet, and employee profiles

Simulated Turbine Camera Views

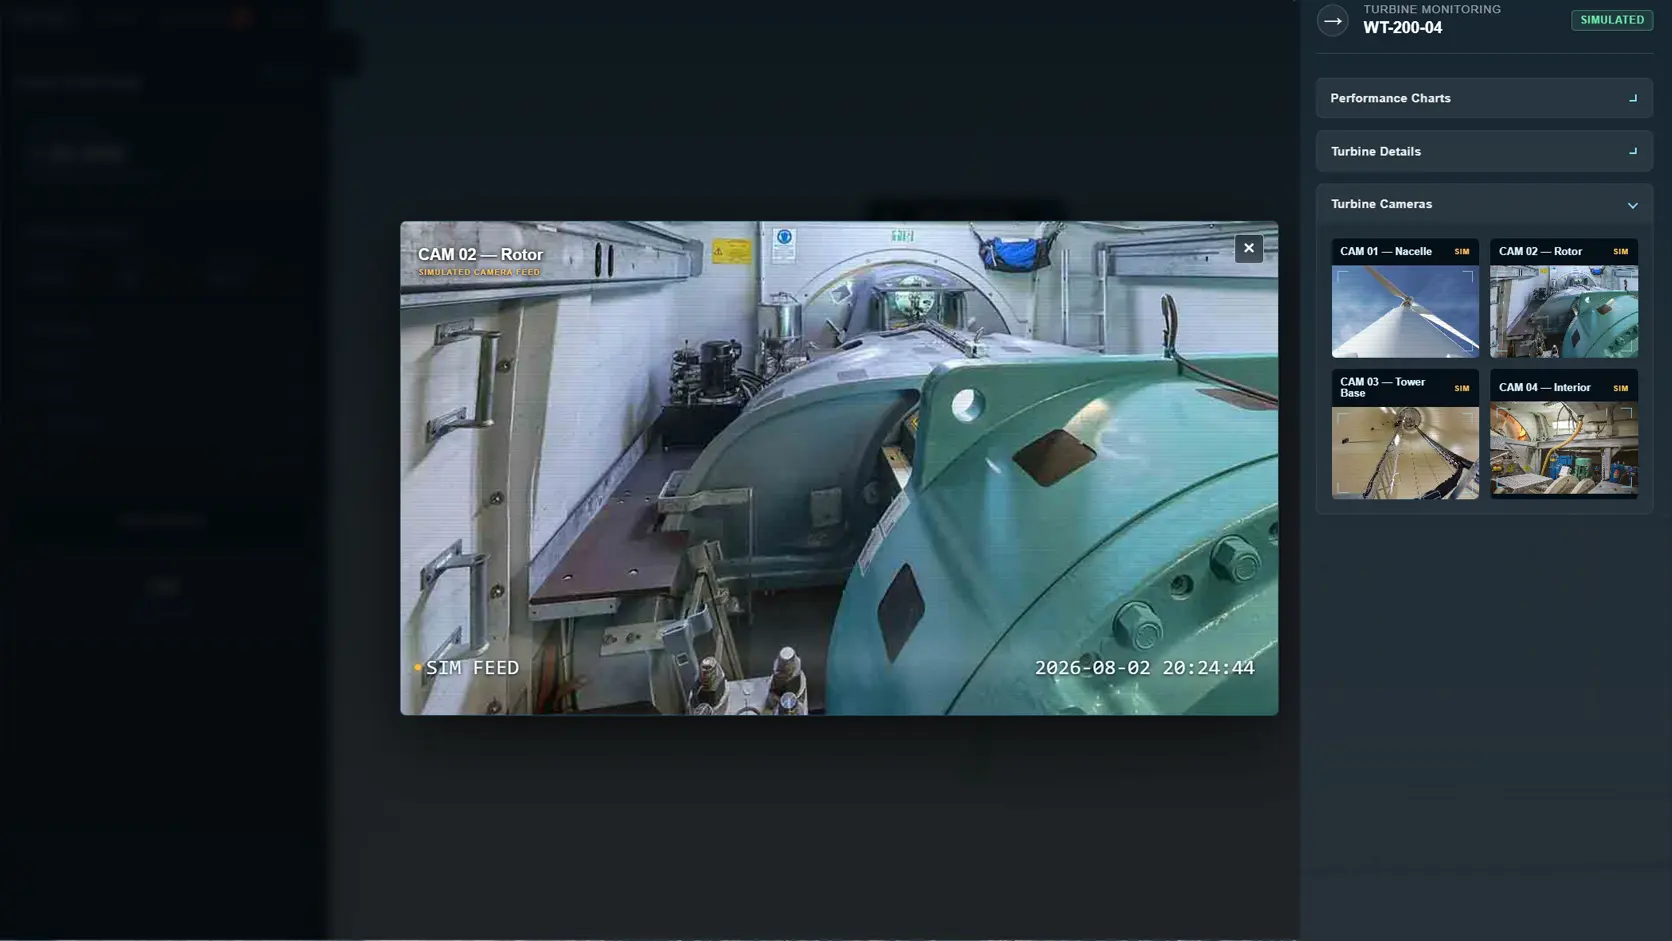
Selected turbines expose four simulated inspection views: nacelle, rotor, tower base, and interior.

The camera interface includes lazy image loading, recording state, live time, monitoring overlays, expandable views, keyboard closing, focus restoration, and a responsive 2×2 mobile layout.

The feeds are intentionally identified as simulated images. Their purpose is to demonstrate how visual inspection context could be integrated into an operational asset view.

WindTwin simulated turbine monitoring camera interface

Scaling from Four Assets to a 100-Turbine Farm

The default experience loads four high-detail turbines for direct interaction. The expanded farm is introduced only when requested.

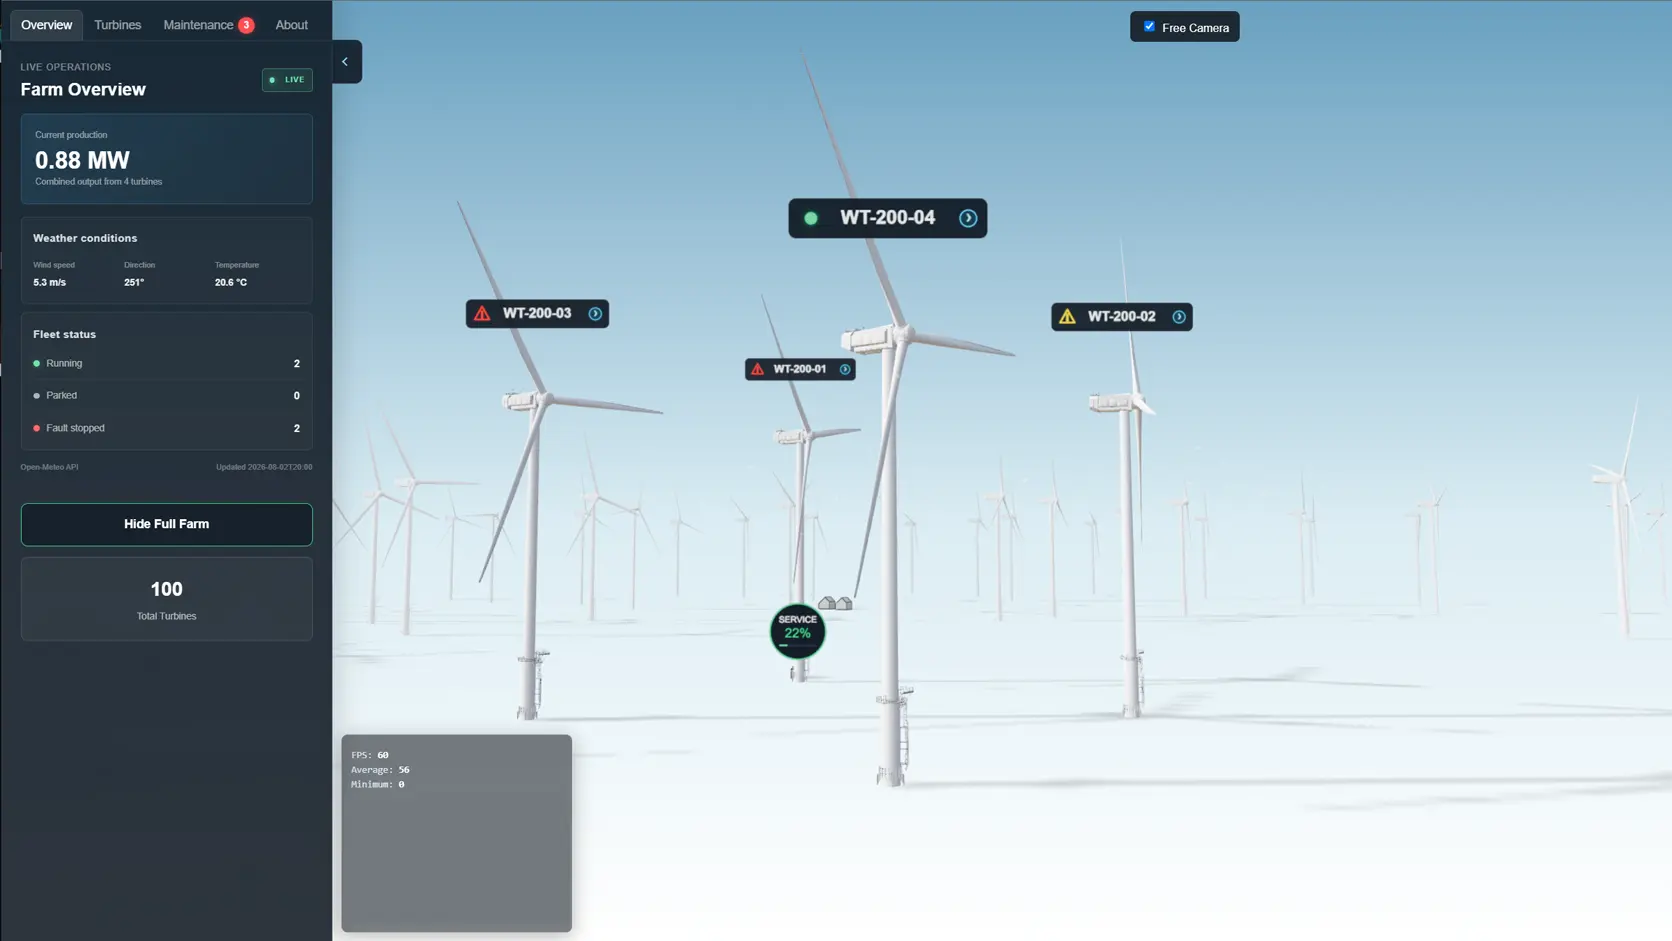
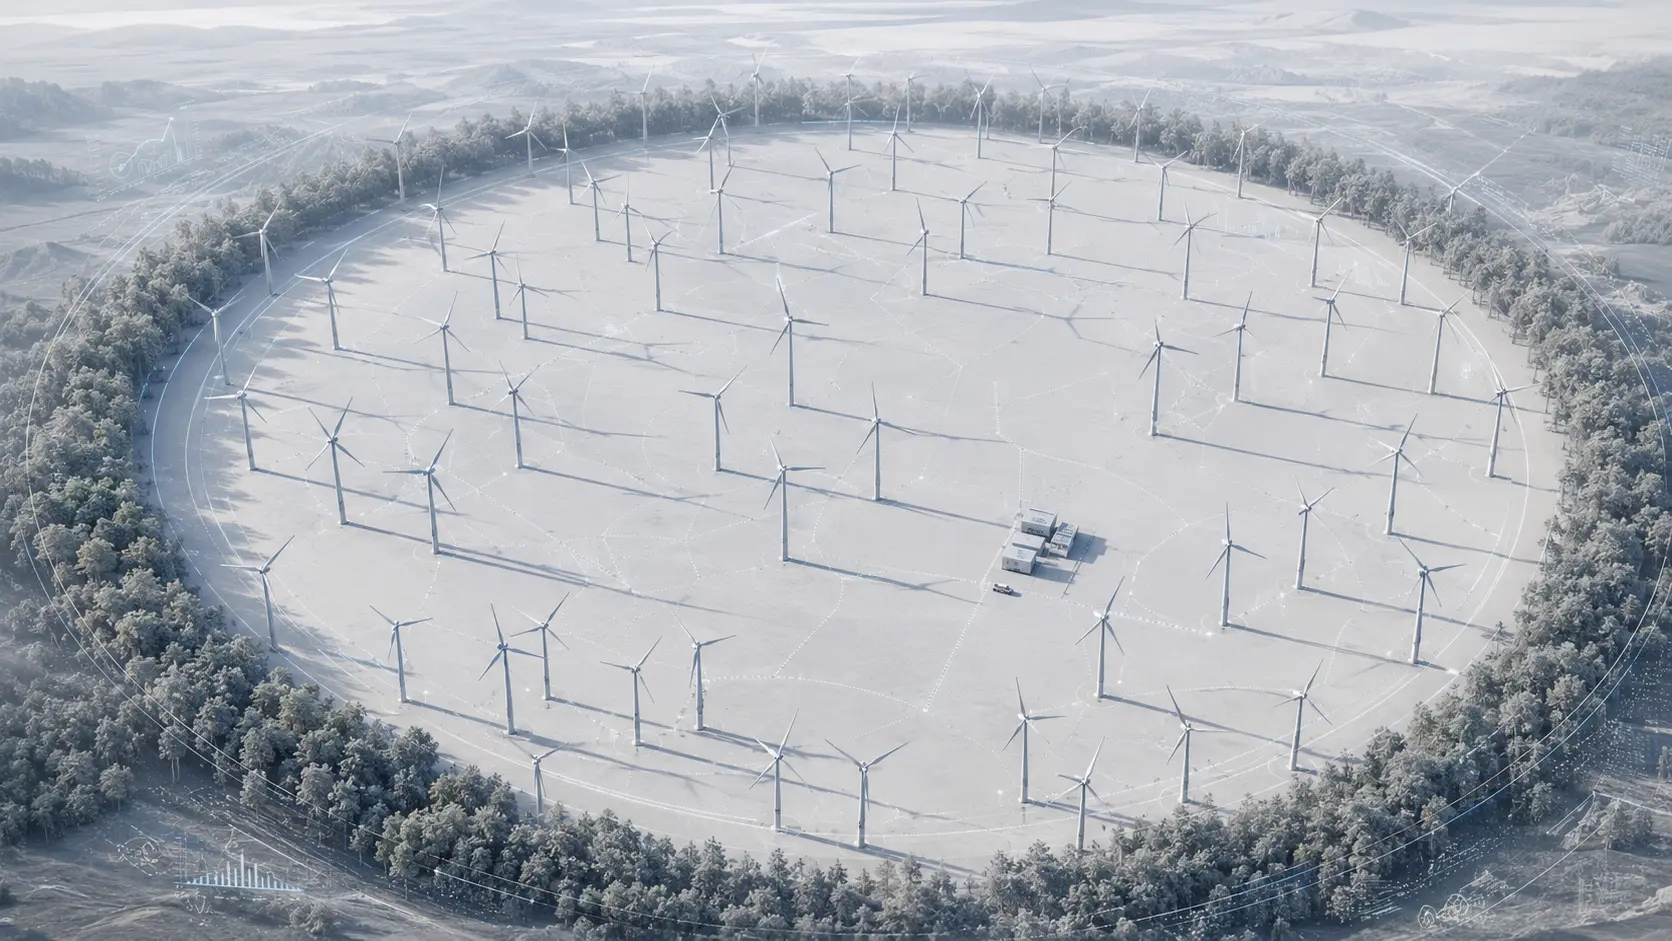
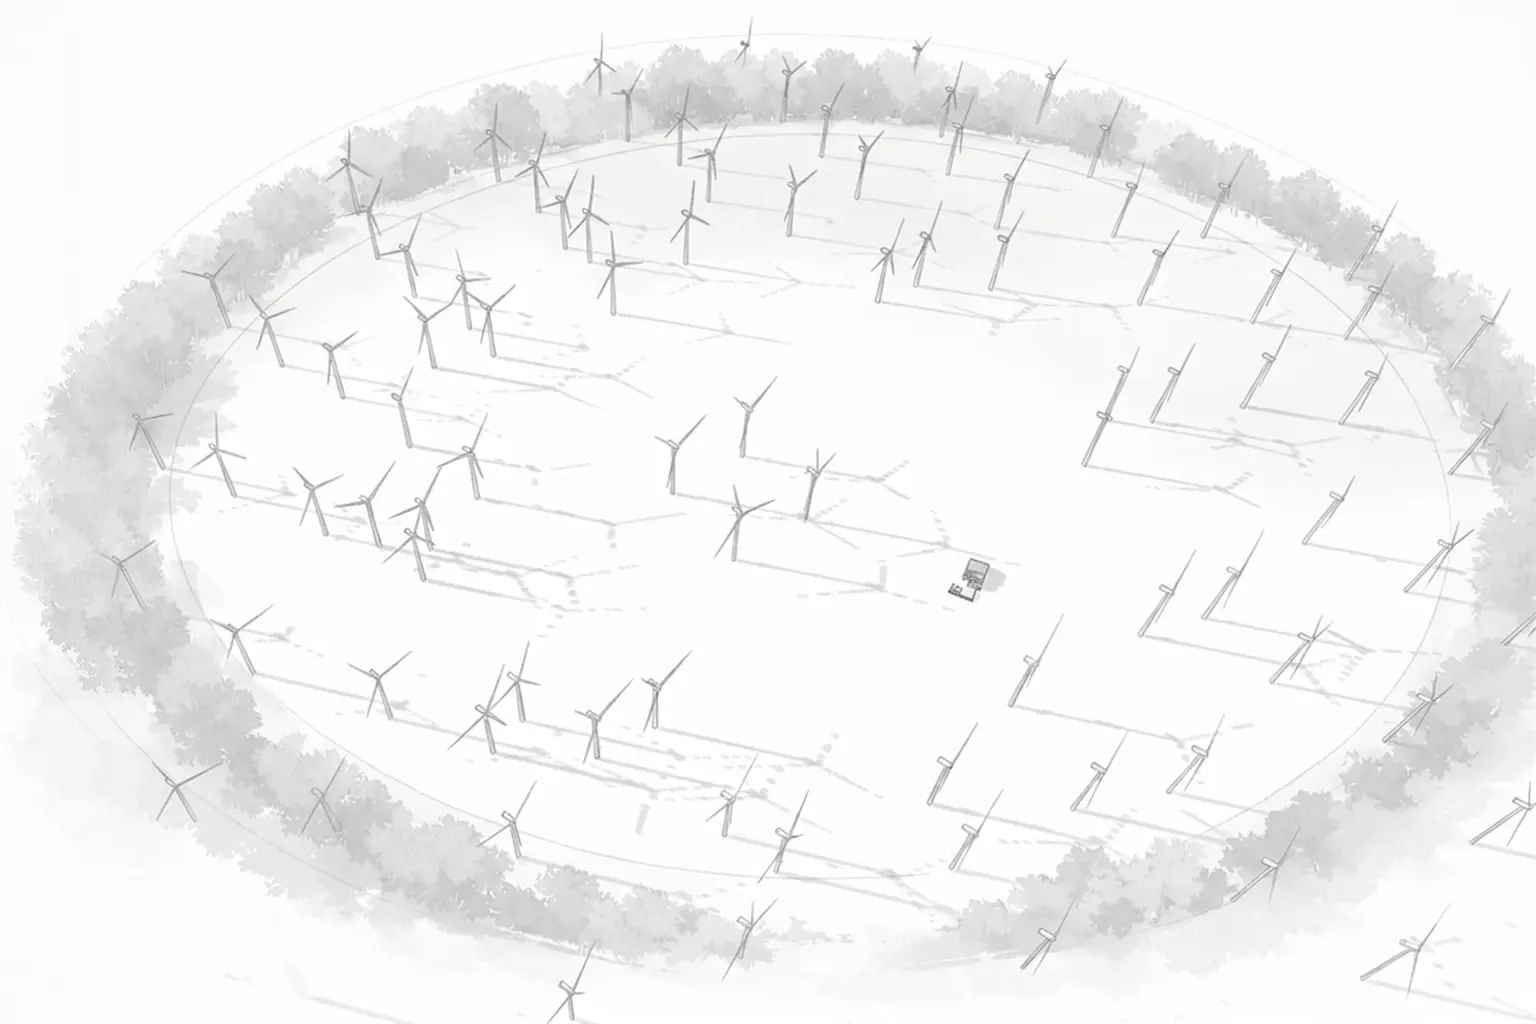
Full Farm mode dynamically imports and adds 24 medium-detail and 72 low-detail turbines, producing a total environment of 100 assets. Their rotors respond to the active simulated speed, and their nacelles follow wind direction.

Enabling the larger environment also adjusts camera range, fog, shadow-map resolution, and mobile-versus-desktop rendering cost. Disabling it restores the higher-quality near-scene configuration.

This is an explicit level-of-detail and runtime-budget decision: the user receives fast access to the operational core without paying the full cost of the distant farm before it is needed.

WindTwin expanded 100-turbine wind farm using multiple levels of detail

Performance Engineering

Performance was treated as a product requirement from the start, because an operational interface loses value when navigation, selection, and state changes feel delayed.

The project uses on-demand full-farm loading, dynamic imports, full/medium/low turbine detail levels, shared materials for repeated distant assets, frustum culling, lazy camera images, deferred analytics and operations modules, and Chart.js loaded only when charts are first required.

Rendering quality is adaptive rather than fixed. A dedicated quality manager samples sustained FPS and moves between High, Medium, Low, and Very Low profiles, adjusting device pixel ratio, shadow resolution, and — at the lowest profile — shadow rendering itself. Warm-up periods, trimmed averages, hold times, and cooldowns prevent one-off dropped frames from causing unstable quality changes.

Runtime monitoring records current, average, and minimum FPS; draw calls; triangle, geometry, and texture counts; pixel ratio; GPU; and fully loaded time. Quality measurements pause while the tab is hidden and restart with a warm-up period when focus returns, avoiding false quality reductions caused by background-tab throttling.

The latest desktop diagnostic snapshot maintained approximately 60 FPS with the expanded environment while rendering about 214,000 triangles in 39 draw calls on a GTX 1060 3GB system.
WindTwin performance engineering and measured runtime metrics

Adaptive Quality and Deferred Loading

WindTwin does not assume that every device can afford the same rendering settings. A runtime quality manager samples sustained FPS and can move between High, Medium, Low, and Very Low profiles.

These profiles adjust device pixel ratio and shadow resolution, and the lowest profile can disable shadows completely. Full Farm mode applies additional shadow limits, with stricter caps on mobile devices. Warm-up periods, trimmed FPS averages, transition hold times, cooldowns, and visibility-aware measurement prevent temporary spikes or background-tab throttling from causing unstable changes.

Loading follows the same performance philosophy. Medium- and low-detail farm layers, Operations Center views, employee profiles, performance diagnostics, analytics, and Chart.js are deferred until they are needed. After critical scene assets load, a START action begins the operational experience, including weather updates, telemetry, analytics, fault scheduling, and audio.

Responsive Industrial UI

A complex monitoring interface cannot simply shrink to fit a phone. WindTwin uses behavior changes rather than only smaller dimensions.

The left and right panels collapse independently. On mobile, opening one panel prevents the other from covering the viewport. Camera feeds switch to a 2×2 layout, interaction targets become larger, work-order drag and drop remains touch compatible, and UI layers stay above scene labels and tooltips.

Collapsible section state is saved through local storage. The loading flow is also start-gated: critical scene assets load first, then a START action begins audio, weather updates, runtime telemetry, performance monitoring, analytics, fault scheduling, and the active operational experience.

The project was tested on desktop and multiple mobile devices, including recent Samsung Galaxy and iPhone hardware.

WindTwin responsive interface across desktop and mobile devices

3D Interaction without Losing UI Control

Scene interaction uses raycasting and pointer events for turbines, the service vehicle, and the Operations Center.

Hover tooltips, click-for-details hints, selected-state outlines, and camera movement make the environment understandable without requiring the user to learn a separate control system.

A drag-distance check prevents orbit movement from being interpreted as a click. Hover processing is limited through requestAnimationFrame, and UI layering prevents 3D labels from blocking operational panels.

These details are small individually, but together they determine whether a browser-based 3D product feels reliable or frustrating.

WindTwin 3D selection and interaction states

Important Engineering Decisions

Central state instead of UI-owned values
Turbines, alerts, work orders, vehicle state, queue order, and subscriptions are coordinated through a shared store. This reduces disagreement between the scene and the interface.

Operational flow before visual expansion
The project first proves the alert-to-repair loop with four primary assets. The 100-turbine environment expands spatial scale without weakening the operational core.

On-demand complexity
Distant farm layers and several non-critical application modules are dynamically loaded only when requested, keeping the initial experience focused and avoiding unnecessary download, execution, and rendering cost.

Adaptive rendering instead of one fixed quality level
Sustained FPS measurements control pixel ratio and shadow cost across multiple quality profiles. Full Farm mode also applies stricter shadow limits, especially on mobile devices.

One service vehicle, explicit queue rules
A single active vehicle makes priority and sequencing visible. It also exposes real scheduling questions instead of hiding them behind unlimited simulated resources.

Honest simulation boundaries
The system clearly distinguishes live weather from synthetic operational data and simulated camera feeds. Credibility is treated as part of the design.

Technology Stack

Real-time 3D:
Three.js 0.185 · WebGL · GLTF assets · HTML5 Canvas

Application engineering:
TypeScript 6 · Vite 8 · Vanilla DOM architecture · Centralized state and subscriptions · Dynamic imports · Adaptive quality management

Data and visualization:
Open-Meteo API · Internal simulation · Chart.js 4.5 · Runtime diagnostics and analytics

Delivery:
GitHub Actions · GitHub Pages · Responsive browser deployment

Vanilla TypeScript was chosen intentionally. It keeps the rendering lifecycle, state synchronization, pointer behavior, DOM updates, and performance costs explicit instead of hiding them behind a UI framework abstraction.

Scope, Limitations, and Production Path

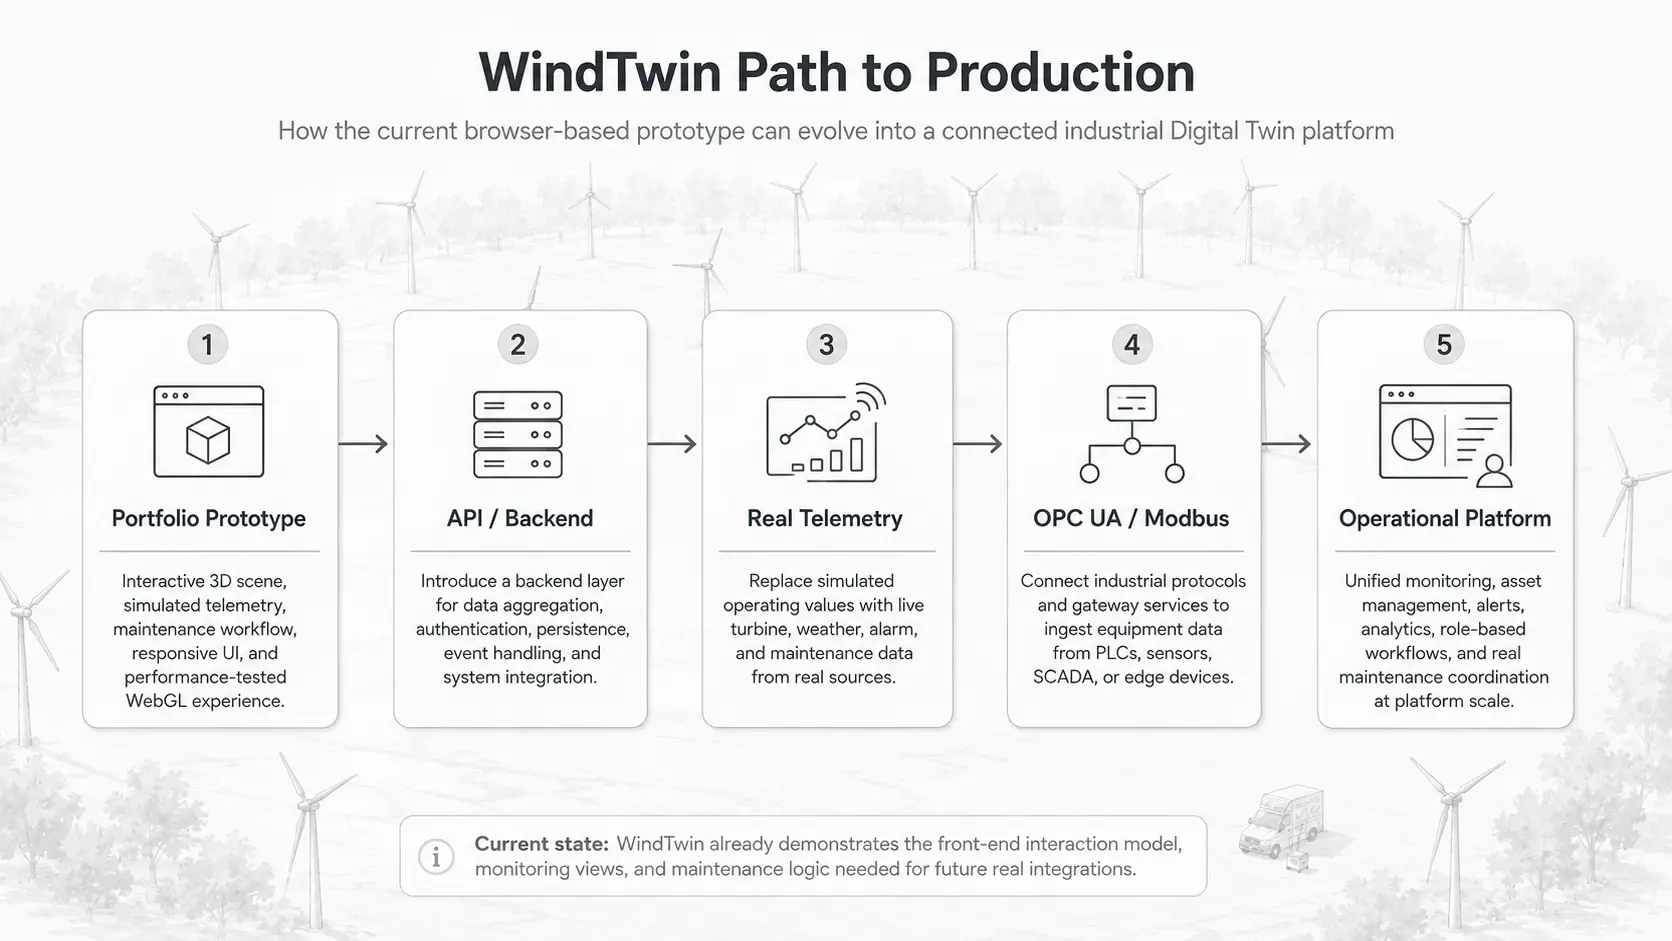
WindTwin is an industrial visualization and portfolio prototype. It is not a production SCADA system, is not connected to physical PLCs or field sensors, and must not be used for operational decisions.

That limitation is architectural rather than conceptual. The current simulation and weather services can be replaced or extended with a backend that receives real telemetry through systems such as OPC UA, MQTT, Modbus gateways, REST, or WebSocket streams.

A production version would also require authentication, authorization, persistent storage, audit logs, alarm governance, data validation, secure device connectivity, redundancy, testing, observability, and integration with maintenance and workforce systems.

The value of the prototype is that the interaction model, asset state, monitoring views, maintenance workflow, and 3D synchronization are already represented as a connected front-end system ready to receive a real data layer.

WindTwin path from portfolio prototype to real industrial integration

Why This Project Matters

WindTwin demonstrates a combination that is often separated in portfolio work: real-time graphics, front-end systems engineering, industrial domain modeling, operational workflow, responsive UI, and measurable performance.

It shows the ability to move beyond a beautiful Three.js scene and design a product where rendering supports decisions, state drives behavior, and the interface explains what is happening and what should happen next.

The same architectural approach can be adapted to factories, warehouses, energy systems, HVAC installations, logistics networks, training simulators, and other asset-heavy environments.

Outcome

WindTwin became a complete operational Digital Twin prototype rather than a wind-turbine visualization demo.

It combines an interactive 100-turbine environment, live weather context, structured asset state, condition monitoring, realistic fault scenarios, prioritized work orders, animated maintenance, personnel and supply context, camera views, audio feedback, responsive behavior, adaptive rendering quality, dynamic loading, and runtime performance diagnostics.

Most importantly, these parts are not isolated. They participate in the same operational story from detection to recovery.

The project represents the direction of Nourtin: browser-based real-time 3D systems built for industrial visualization, simulation, monitoring, and Digital Twin experiences.

WindTwin final operational Digital Twin overview

View Live Project